Render D3.js Charts Server-side
— JavaScript, Node.js, D3.js
The D3.js library can be used on the client-side or the server-side. This post will explain how to use JSDOM to render a D3 chart visualization on the server-side with Node.js.
Setting up D3 on the Server-side
First install D3 with npm npm install d3. The D3 library was re-written in version 4 to be modular so if you're using D3 version 4 or greater you have two options:
- require the whole D3 library:
const d3 = require('d3'); - require just the modules you need. Ex:
const d3 = Object.assign( {}, require("d3-selection").require("d3-scale"), require("d3-axis"), require("d3-array"));The d3-selection module depends on the DOM for operations like selecting elements and setting attributes. Luckily we can use JSDOM to get d3-selection working in Node-land.
const jsdom = require("jsdom");const { JSDOM } = jsdom;// create a new JSDOM instance for d3-selection to useconst document = new JSDOM().window.document;
d3.select(document.body).append("div");// and so onJSDOM is commonly used for unit testing modules that rely on the DOM. That way you can unit test client-side code without a browser. The d3-selection library uses JSDOM for unit testing so reference those tests for more examples.
Demo App
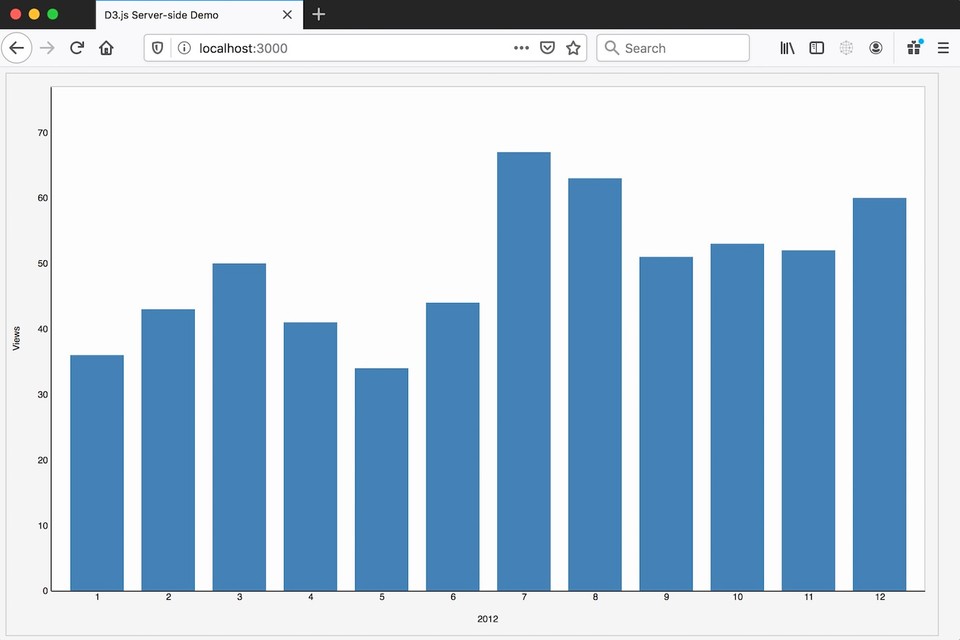
The demo app I put together creates a helper for server-side rendering bar charts with D3. Here's an example of the helper in action:
barChartHelper.getBarChart({ data: fixtureData, width: 400, height: 300, xAxisLabel: "2012", yAxisLabel: "Views", containerId: "bar-chart-small",});At the time of this writing it's using D3 version 5 and Node.js version 12. Check out the source code on GitHub: https://github.com/gregjopa/d3-server-side-demo