Render SVG Charts Server-side with D3.js
Update:
This blog post is really old. Here's a more recent post about this topic:
Render D3.js charts server-side with Node version 12+
It's common to use d3.js to render svg charts on the client-side. With the d3 node module you can render svg charts on the server-side as well. The d3 node module uses jsdom to simulate the browser's Document Object Model (DOM) which allows for d3 selectors to work on the server-side.
Running D3 on the server with Node.js is pretty easy. You can reuse most of your client-side d3 code on the server. The only tricky part is integrating d3 widgets into your server-side views.
Getting started with running D3 on Node.js
Install the d3 node module using npm: npm install d3. The d3 node module uses jsdom which requires a C++ compiler. Read more about this dependency here: https://github.com/tmpvar/jsdom#contextify
After you get d3 installed you can require it like any other node module:
var d3 = require("d3");Reusable Chart Pattern
I recommend using the reusable chart design pattern for your charts: http://bost.ocks.org/mike/chart/. This modular pattern works great on the client and on the server. Since the reusable chart pattern is just a function you can assign it directly to module.exports:
var barChart = module.exports = function() { ...D3 View Helper
My demo app uses the express.js web framework with the ejs templating engine. I want to be able to integrate my D3 chart widgets into my view templates. I accomplished this by appending my chart widget to the jsdom and then getting it's outerHTML value and rendering it in my ejs template:
bar_chart_helper.js
var getBarChart = function (params) { var chart = barChart() .data(params.data) .width(params.width) .height(params.height) .xAxisLabel(params.xAxisLabel) .yAxisLabel(params.yAxisLabel);
// append to jsdom d3.select("body").append("div").attr("id", params.containerId).call(chart);
var selector = "#" + params.containerId;
// get html string "<div id="bar-chart-small"><svg class="svg-chart"> ..." var svg = d3.select(selector).node().outerHTML;
// remove from jsdom d3.select(selector).remove();
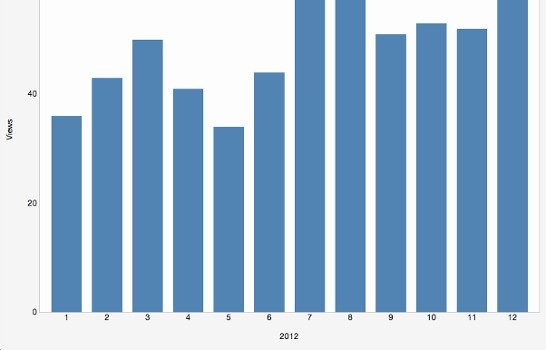
return svg;};index.html
<!-- ejs template --><h1>D3 Server-side Demo</h1><%- barChartHelper.getBarChart({ data: fixtureData, width: 400, height: 300,xAxisLabel: '2012', yAxisLabel: 'Views', containerId: 'bar-chart-small' }) %>To see this code in action download my d3-server-side-demo express.js app here: https://github.com/gregjopa/d3-server-side-demo